June CPI Fell While the Fed Held at 3.63%: Understanding the Divergence
June CPI fell 0.42% month over month to 332.568 while the Fed held at 3.63%, creating a strong but still conditional rate-path signal.
June CPI Fell While the Fed Held at 3.63%: Understanding the Divergence
June CPI fell even as the Fed held at 3.63%. That split gives the model a dovish signal, but one soft month cannot settle the rate path.
June broke the recent CPI trend
The June 2026 Consumer Price Index was 332.568, down from 333.979 in May. The -0.42% month-over-month move ended a four-month run of gains, while headline CPI remained about 3.46% higher than a year earlier.
The six-month index path shows the reversal clearly: 326.588 in January, then 327.460, 330.293, 332.407, 333.979 in May, and 332.568 in June. June 2025 was 321.435.
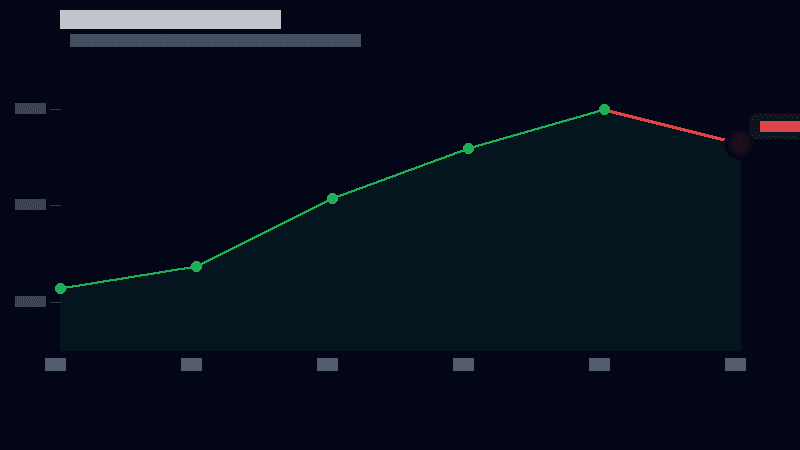
Against its trailing window, MaximizeROI’s divergence model scores the monthly change at roughly -3 standard deviations. That makes June an unusually strong single-feature signal, not proof that inflation has been defeated.
The surrounding data lean soft, not recessionary
The Federal Funds Effective Rate held at 3.63%, with the daily series also at 3.63% in mid-July. The rest of the dashboard was mixed:
- Unemployment was 4.2% in June, and initial jobless claims were 208,000 for the week of July 11.
- Nonfarm payrolls were 158.98M in June.
- The NASDAQ Composite was 25,520 on July 17.
- WTI crude was $79.20, and regular gasoline was $3.855/gal in mid-July.
- Consumer sentiment was 44.8.
The combination points to sharp monthly disinflation, contained energy prices, and a labor market that is loosening without breaking. Depressed sentiment sits uneasily beside the still-moderate unemployment rate.
Why the model and the Fed path separate
The model reacts quickly to the fresh CPI outlier, stable energy prices, and claims near 208k. That mix leans toward disinflation and gives policy more room to ease.
Fed-decision contracts price something slower: how the FOMC will respond across scheduled meetings. A single release can change the data signal before it changes the expected policy decision. That difference in speed is the core divergence.
Other frictions can widen it. Traders may discount one soft month after four increases. Contracts such as “Fed decision in [month] 2027?” and “Number of Fed rate changes before 2027” settle on discrete outcomes, while a nowcast produces a continuous estimate. Thin liquidity or uncertainty about settlement can also slow repricing.
What would confirm or reverse the signal
The June move becomes more persuasive if the next CPI release, weekly claims, payrolls, and energy prices continue to soften. A rebound toward the earlier trend would make June look more like a one-month interruption.
For a rate-path contract, the analysis also has to bridge the gap between economic data and an FOMC decision. A dovish data signal is not enough if the timing, settlement rules, fees, spread, and order-book depth erase the proposed edge.
A disciplined review should therefore:
- Test the position against a one-month head-fake scenario.
- Track the next CPI, claims, payrolls, WTI, and retail gasoline readings.
- Confirm exactly which FOMC outcome settles the contract.
- Define position size and exit conditions before trading.
The signal is strong but conditional
The roughly -3 standard-deviation reading depends heavily on one CPI release. Data revisions or a reversal in the next vintage could make today’s outlier look less important. Prediction markets add their own limits, including concentrated positions, participation bias, and settlement ambiguity.
June’s -0.42% move to 332.568 is still meaningful. With the Fed at 3.63%, unemployment at 4.2%, and claims at 208k, the data tilt more dovish than a steady-rate path. The divergence is a reason to investigate and monitor—not a conclusion that the market is wrong.
Data sources and risk notice
- Consumer Price Index for All Urban Consumers (CPIAUCSL) — FRED / Ready Signal feature series.
- Federal Funds Effective Rate (FEDFUNDS, DFF), Unemployment Rate (UNRATE), Initial Jobless Claims (ICSA), Nonfarm Payrolls (PAYEMS), and Consumer Sentiment (UMCSENT) — FRED / Ready Signal feature series.
- NASDAQ Composite (NASDAQCOM), WTI Crude (DCOILWTICO), and Regular Gasoline Price (GASREGW) — FRED / Ready Signal feature series.
- Referenced Kalshi rate-path contracts include “Fed decision in [month] 2027?”, “Number of Fed rate changes before 2027,” and “How high will inflation get this year?” Verify live pricing and terms on the platform.
This article is for informational purposes only and is not financial, investment, or trading advice. It is not a recommendation to buy or sell an asset or participate in a prediction market. Verify current data and contract terms before acting.